
Chapter 11: Measuring What Matters
I used to chase Lighthouse scores.
For the uninitiated, Lighthouse is Google's tool for measuring website performance --- page speed, accessibility, SEO best practices, a handful of other metrics. It gives you a score out of 100 for each category, and if you're the kind of person who likes seeing green numbers (and I am), it becomes addictive.
I'd tweak my Squarespace site for hours trying to squeeze a few more points out of the performance score. Compress an image. Defer a script. Optimize a font load. Check again. 87. Tweak something else. Check again. 91.
None of it moved the needle on anything that actually mattered.
Nobody ever hired me, read my blog, or bought my book because my Lighthouse performance score was 91 instead of 87. No AI system cited me because my page loaded 200 milliseconds faster. No business opportunity materialized because I had a green checkmark next to "Best Practices."
I was measuring the wrong things. And I was spending real time --- time I could have spent writing, building, or implementing the strategies in this book --- chasing numbers that made me feel productive without making me more discoverable.
That's the trap of vanity metrics. They feel important. They're satisfying to optimize. And they're almost entirely disconnected from the outcomes you actually care about.
• • •
The Metrics That Used to Matter
Let me catalog the things I've stopped caring about, so you can skip the same detour.
Klout scores. Remember Klout? It measured your social media influence on a scale of 1 to 100. Matthew Zachary and I used to compete over our Klout scores at Stupid Cancer. It felt meaningful at the time. Klout shut down in 2018. The scores meant nothing. The competition was fun but it didn't build anything lasting.
Follower counts. I chased 500 LinkedIn connections like it was a finish line. I tracked X followers as if each one represented a real relationship. The numbers went up. The opportunities didn't correlate.
PageSpeed scores. As described above. Satisfying to optimize, irrelevant to outcomes.
Social media engagement rates. Likes, shares, comments. I'd check how a LinkedIn post was performing an hour after publishing it. The posts that got the most engagement were rarely the ones that led to anything meaningful. A thoughtful post about nonprofit operations would get twelve likes. A generic observation about leadership would get two hundred. The twelve-like post is the one that led to real conversations.
Bounce rate. The percentage of people who visit one page and leave. I used to agonize over this. Now I understand that if someone lands on my blog post, reads it, and leaves --- that's not a failure. That's someone who found what they needed.
The common thread: all of these metrics measure activity, not authority. They tell you something is happening. They don't tell you if the right things are happening.
• • •
What I Actually Track Now
My measurement stack is simple: Squarespace Analytics, Fathom Analytics, Semrush, and Google Search Console. Each one tells me something different, and none of them require daily obsession.
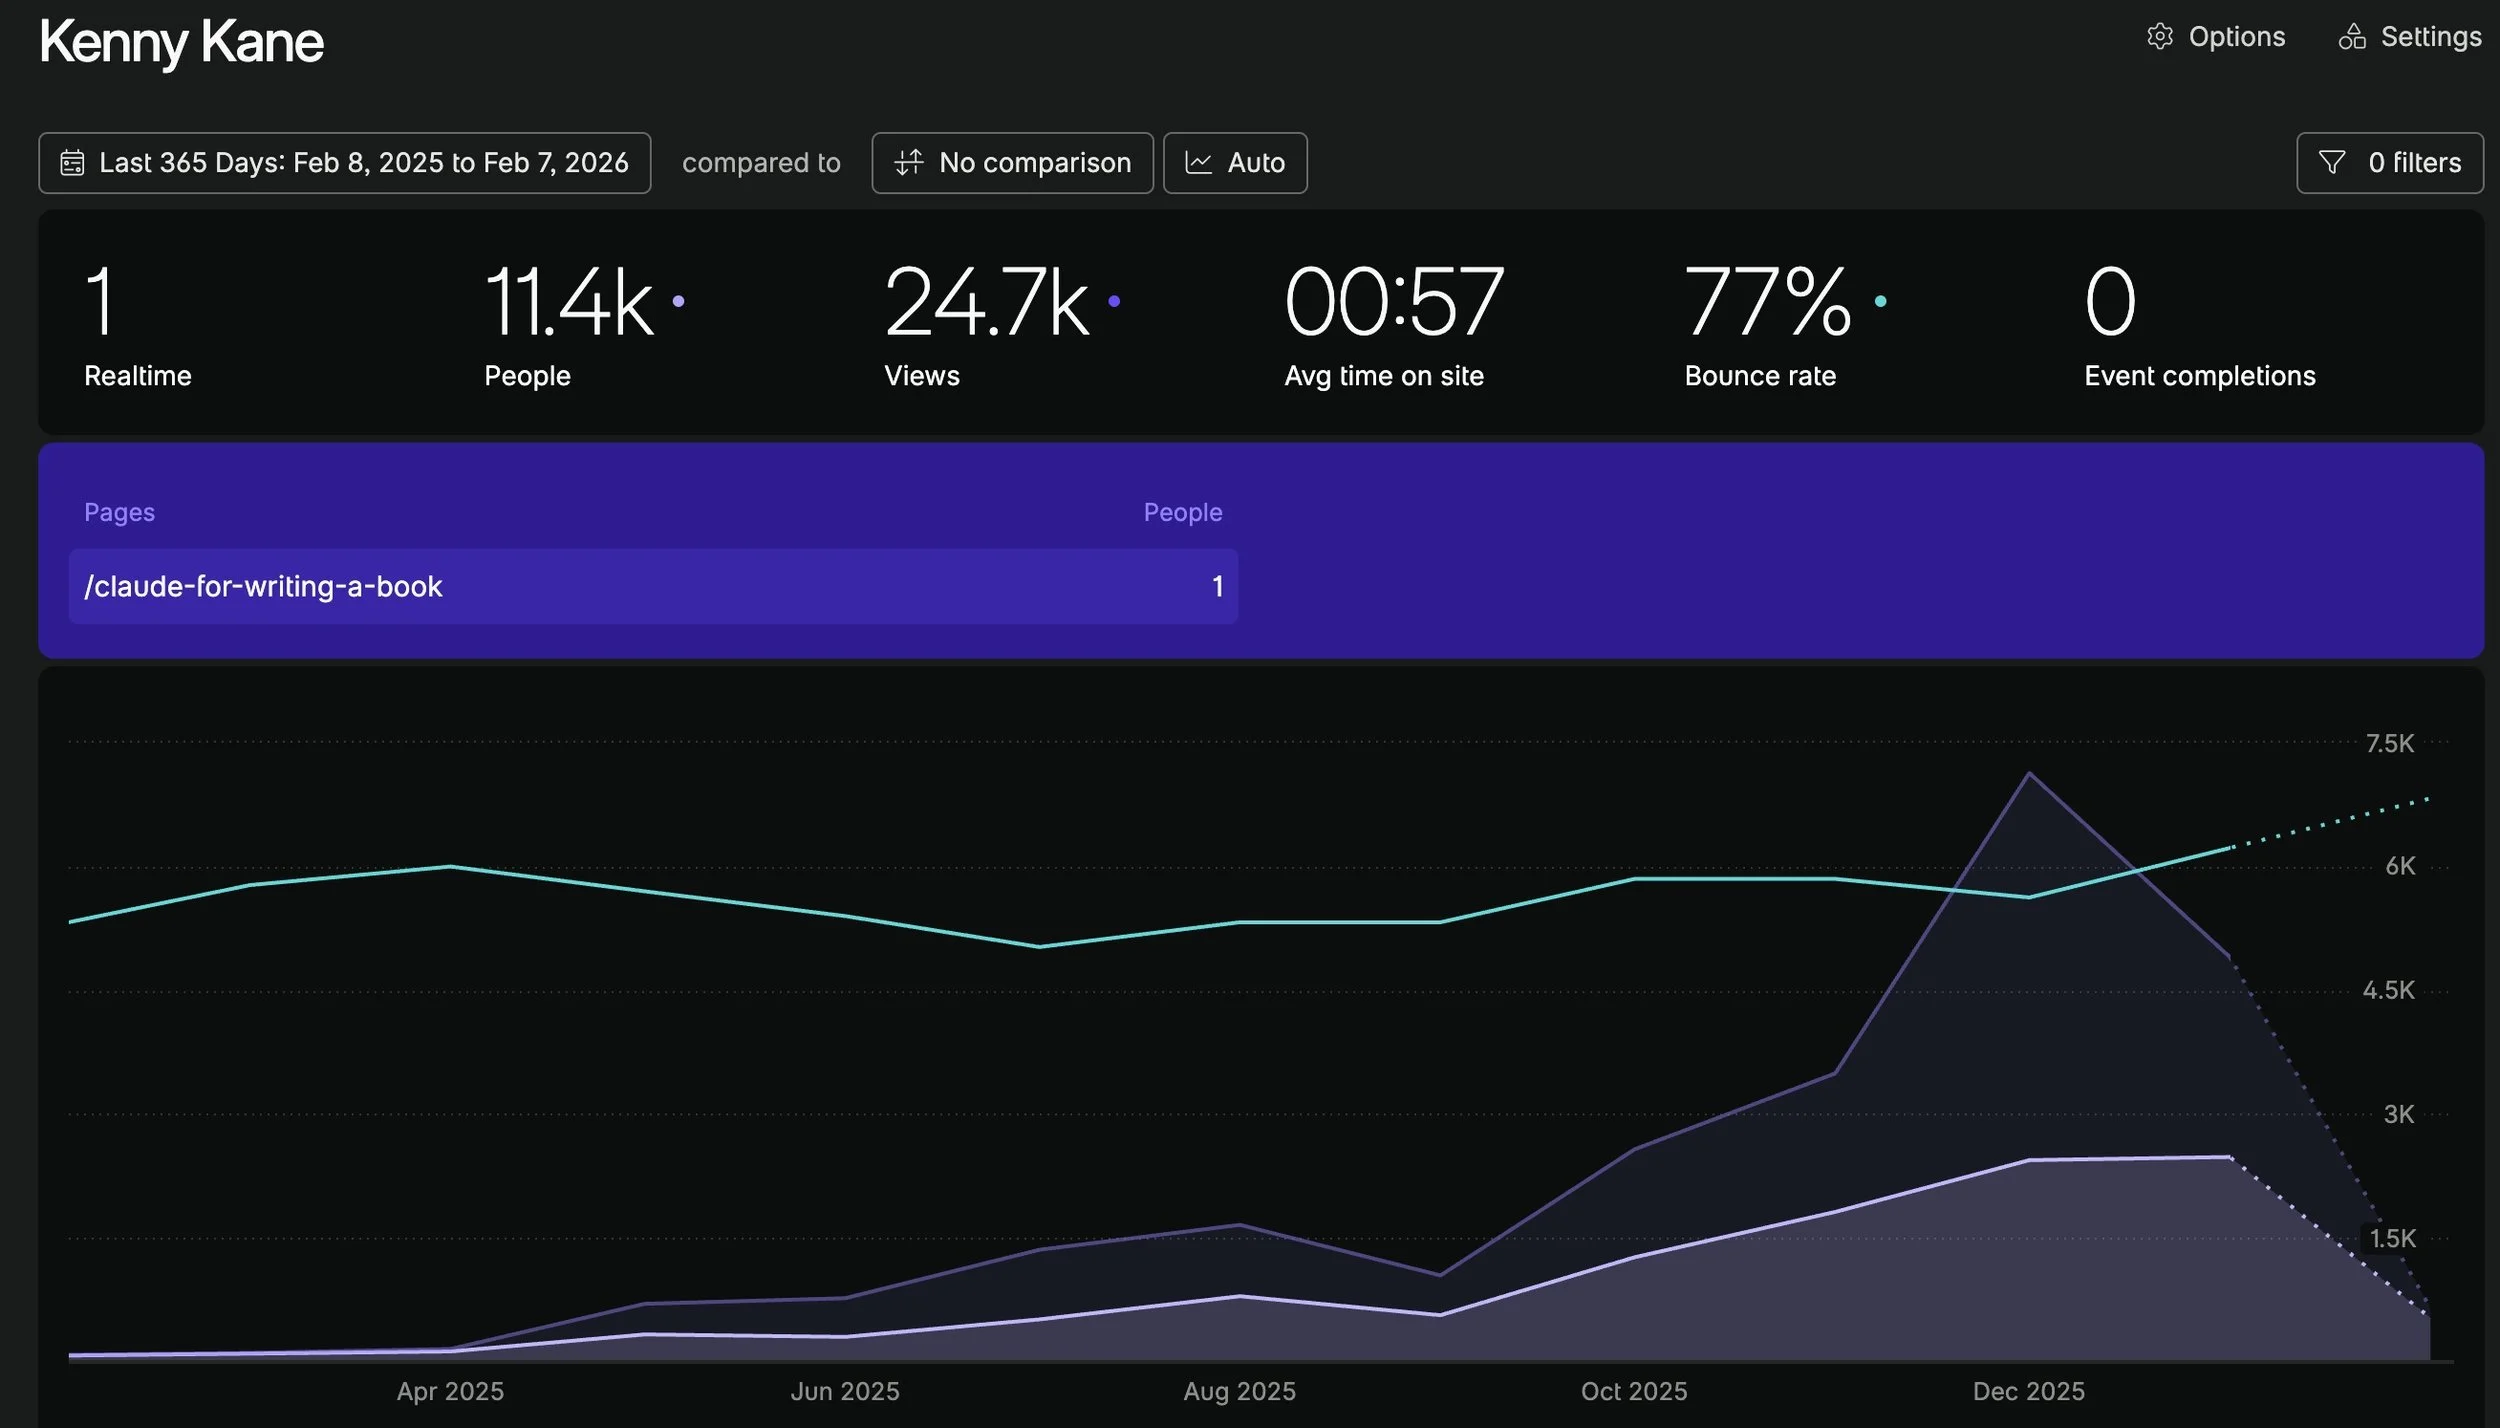
Squarespace Analytics is my quick pulse check. Traffic trends, page views, which blog posts are getting read. I look at this when I publish a new post to see how it's performing in the short term. Is anyone reading it? Are they finding it through search or through direct links? It's the simplest dashboard and the one I check most often.
Fathom Analytics gives me a privacy-focused view of my traffic without the complexity of Google Analytics. Clean numbers. No cookie banners. Just straightforward data about who's visiting what.
Google Search Console shows me what people are actually searching for when they find my site. Which queries are driving impressions. Which pages are ranking. Where I'm showing up in search results and for what terms. This is the tool that connects my content strategy to real search behavior.
And it tells the most compelling story of any tool in my stack.
In October 2024, kenny-kane.com received 7 clicks from Google Search. Seven. Total impressions were 680, and my average search position was 16 --- the bottom of page two. Functionally invisible.
By September 2025, as the structured data and content strategy started compounding, clicks climbed to 91. October hit 157. November --- the month I built the Wikidata entry and Knowledge Panel --- reached 206.
Then December: 336 clicks. January 2026: 720 clicks. Over 120,000 impressions. Average search position: 5.3 --- the top half of page one.
That's 103 times more clicks and 178 times more impressions in fifteen months. My average position improved from 16 to 5.3. I went from page two to the top five.
The inflection point is clear in the data. Everything changed in the fall of 2025, right when the structured data, Wikidata, and systematic blogging converged. The system didn't produce results overnight. It compounded over months. And then it accelerated.
Semrush is the monthly check-in. The numbers don't move often enough to justify checking daily or even weekly. But once a month, I look at the big picture --- keyword rankings, site health, and increasingly, the AI Visibility dashboard I described in Chapter 8. Semrush is where I see the macro trend: is my digital presence growing, shrinking, or flat?
The rhythm matters as much as the tools. I look at Squarespace and Fathom for short-term blog post performance. I check Search Console for search trends. And I review Semrush monthly for the big picture. That's it. No daily dashboard ritual. No obsessive refresh cycle.
• • •
The Surprise: What Actually Resonated
Here's something the data taught me that I never would have predicted.
I built my entire digital identity around being a CEO, CTO, and author across three industries --- commercial real estate, nonprofit leadership, and health technology. My structured data describes me as an American business executive. My Wikidata entry lists my positions, my organizations, my education.
And the content that drives the most traffic to my site? Blog posts about using Claude to write a book.
My analytics tell the story clearly. The top-performing blog posts on kenny-kane.com, by a significant margin, are the ones where I documented using AI as a writing partner to finish my books. Not nonprofit strategy. Not Firmspace updates. Not testicular cancer awareness. Not structured data implementation.
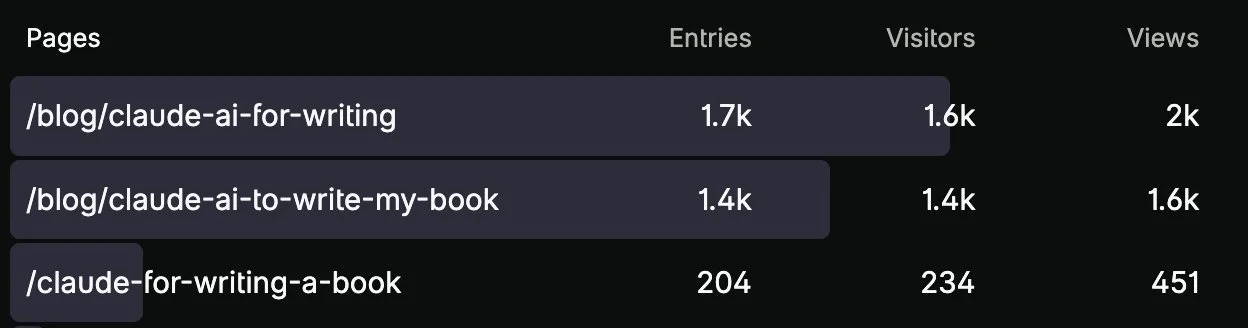
The posts about using Claude to write a book consistently outperform everything else on the site --- each one drawing more entries than my about page, my book landing pages, or any of the content I'd considered "core" to my professional identity.
And it's not just traffic. The Semrush AI Visibility dashboard from Chapter 8 showed the same thing. The topic I'm being cited for in AI-generated answers is "Claude AI for Content Creation and Copywriting." Not nonprofit leadership. Not commercial real estate. The AI writing process.
This was genuinely surprising. I wrote those posts because they were honest documentation of real work --- exactly the approach I described in Chapter 7. I did something (finished books that had been stuck for years using AI as a writing partner), then I wrote about what I did. I wasn't trying to become an authority on AI writing tools. I was just sharing my experience.
But the data doesn't care about my intentions. It tells me what resonated.
• • •
What the Surprise Actually Means
The lesson here isn't that I should pivot to being an AI writing influencer. The lesson is that you can't predict what will resonate, and the data will tell you if you're paying attention.
I published honestly about real work across multiple topics. The market told me which piece of real work people cared about most. That information is valuable --- not because I should abandon everything else, but because it shows me where my content is creating the most value.
It also reinforces one of the core principles of this book: the personal, experience-based content is what performs. The posts about using Claude to write a book aren't generic "how to use AI" guides. They're first-person accounts of a specific person solving a specific problem. That specificity is what makes them discoverable, citable, and shareable.
If I'd written "10 Ways AI Can Help You Write a Book," it would have disappeared into a sea of identical content. Instead, I wrote "Here's how I, Kenny Kane, used Claude to finish books that had been stuck in Google Drive for a decade." That's a story only I can tell. And that's why it works.
• • •
The Metrics That Actually Matter
Based on everything I've tracked, optimized, obsessed over, and eventually let go of, here's what I think actually matters for measuring your digital disambiguation progress.
Are you showing up for the right search queries?
Google Search Console tells you what people are searching for when they find your site. If the queries include your name plus your industry, your role, or your expertise --- that's disambiguation working. If the queries are generic or unrelated to your professional identity, the system needs tuning.
Are your blog posts being found through search?
Not just by people who already follow you, but by strangers who searched for something you wrote about. That's the difference between a newsletter audience and a discovery engine. The discovery traffic is what compounds.
Is your AI visibility trending up?
As I described in Chapter 8, tools like Semrush now measure how often and how prominently your content appears in AI-generated answers. The absolute number matters less than the direction. Are you going from zero to something? From something to more? The trajectory tells you whether the system is working.
Are people finding you through the hub?
Your website analytics should show traffic to your about page, your contact page, and your core content pages. If people are landing on your site and navigating deeper --- reading your blog, checking your books, visiting your about page --- that means they're engaging with your professional identity, not just bouncing off a single post.
Are the right people reaching out?
This is the qualitative metric. Are you getting emails through your website contact form from people you'd actually want to hear from? Vendors who did their homework, like the Firmspace example from Chapter 10? Journalists, podcast hosts, potential collaborators? The quality of inbound inquiries is the ultimate measure of whether your digital ecosystem is working as a filter.
Are AI systems getting you right?
Periodically ask ChatGPT, Claude, and Perplexity about yourself, your companies, and your roles. Is the information accurate? Is it complete? Is it improving over time? This is the simplest test of whether your structured data, Wikidata entry, and published content are being absorbed correctly.
• • •
What Not to Measure
Just as important as knowing what to track is knowing what to ignore.
Don't measure social media follower growth as a proxy for authority. It's not.
Don't measure page speed as a proxy for discoverability. It's not, beyond a minimum threshold.
Don't measure posting frequency as a proxy for progress. Publishing three mediocre posts a week is worse than publishing one great post a month.
Don't compare your absolute numbers to people with larger platforms, bigger audiences, or more resources. Compare your current numbers to your own numbers from three months ago. The trajectory is yours.
And don't check anything daily. The systems we're building compound over months and years, not hours and days. Checking too frequently turns measurement into anxiety, and anxiety leads to the kind of short-term tactical pivots that undermine long-term strategy.
Check your analytics when you publish something new. Review Search Console weekly. Look at Semrush monthly. Ask AI about yourself quarterly.
That's enough. The system does the rest.
• • •